
HDB Rooftop Solar in Singapore: Why Your Yield Is 8-12% Below Projection
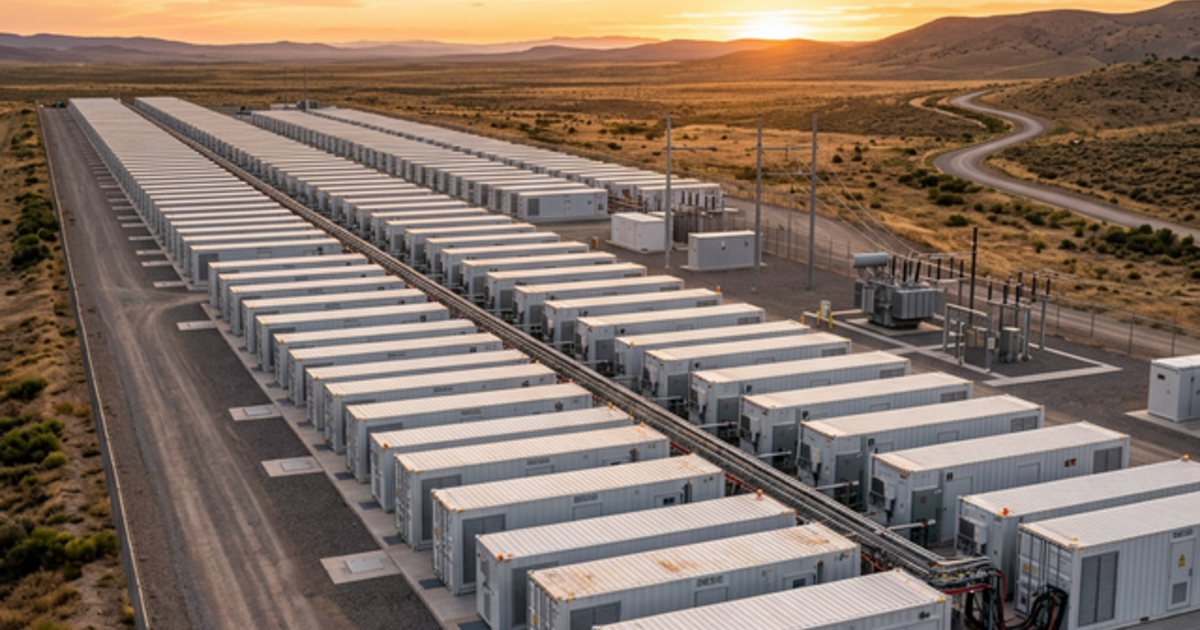
Singapore's SolarNova programme has established HDB rooftop solar as the primary leased solar deployment model for the Lion City. Tens of thousands of HDB residential and carpark rooftops now carry PV panels, with operators including Terrenus Energy, LYS Energy, Cleantech Solar, and Blueleaf Energy managing portfolios ranging from dozens to over 1,000 individual sites.
The business model is straightforward: long-term leases with Jurong Town Corporation or HDB, fixed offtake arrangements, 25-year system design life. The financial model relies on yield projections from pre-installation photovoltaic simulation (PVSyst or equivalent) remaining accurate over the asset lifetime.
They do not. In many portfolios, the divergence starts almost immediately after commissioning.
The Singapore-Specific Yield Gap
P50 yield projections for Singapore HDB rooftop solar are generated using irradiance data (NASA POWER, Meteonorm, or local TMY datasets), module datasheet parameters, and theoretical loss factors. The standard factors modeled are:
- Cable and transformer losses (typically 2-4%)
- Module temperature correction (Singapore ambient: 28-35°C, standard cell correction applied)
- Soiling losses (generic 2-3% annual estimate)
- Inverter efficiency curve (from datasheet)
- Shading (from pre-installation horizon study)
What these projections consistently underestimate:
1. Construction Dust Soiling (Year 0-3)
Singapore is one of the most active construction markets in the world, measured by construction value per km². HDB estates under active construction, with new blocks being raised beside existing ones, generate fine concrete dust and silica particulate that settles on horizontal and low-tilt rooftop panels.
Unlike Saharan dust or agricultural soiling (heavier particles that can be partially removed by rainfall), construction-phase silica dust adheres to glass surfaces at the microscopic level. Rainfall in Singapore's tropical climate creates a thin mud layer that dries and bonds, especially on low-tilt surfaces where runoff is limited.
Measured soiling losses in high-construction-density HDB zones: 4-9% annual yield reduction, roughly double the 2-3% modeled in standard projections. This effect persists until nearby construction completes, which in active HDB estates can mean 3-5 years.
Forensic detection: Soiling losses leave a characteristic daily pattern in string-level irradiance correlation. Clean panels show tight correlation between measured GHI and string current. Soiled panels show a consistent negative deviation from correlation at low-angle morning and afternoon irradiance. The long-path optical effect makes soiling hurt more at oblique angles. This pattern is invisible at inverter-summary level but clear in string-current analysis.
2. Micro-Inverter and Module-Level Power Electronics Thermal Mismatch
HDB rooftop deployments increasingly use module-level power electronics, usually micro-inverters or DC optimisers, to handle shading and module mismatch. These are typically specified at 25°C nominal operating conditions.
Singapore's rooftop temperatures in summer months frequently reach 65-75°C surface temperature on south-facing panels during peak irradiance hours. At these temperatures:
- Micro-inverter MPPT algorithms are operating outside their optimized range
- Conversion efficiency decreases by 0.3-0.5 percentage points per 10°C above rated operating temperature
- Thermal cycling (daily peak-to-trough of 45°C+) accelerates capacitor and component aging, increasing inverter failure rates
For a system designed with micro-inverters at 25°C rated efficiency and deployed in Singapore conditions, conversion efficiency deficit is 2-4% vs. projected from thermal effects alone. Combined with increased failure rate (failed micro-inverters default to string bypass, causing total loss of that module's contribution), the actual MLPE yield gap can reach 5-7%.
Forensic detection: This requires comparing per-module production fingerprints across a long time series. Healthy micro-inverter systems show stable relative production ratios between modules of the same orientation. Thermal-degraded units show progressive divergence, usually faster decline in the hottest zones.
3. Shading From New HDB Blocks
Singapore's HDB construction programme is continuous. When a new residential block is erected adjacent to an existing estate, the shadow envelope cast on existing rooftops changes permanently.
Pre-installation horizon studies model existing structures. They cannot model blocks that have not yet been approved or are in early construction stages at the time of PVSyst analysis. For HDB operators with multi-year installation programmes:
- Systems installed in 2020 may now be shaded by blocks approved in 2021-2022
- The shading impact was not in the original yield model
- Inverter MPPT systems that compensate for partial shading cannot fully recover the irradiance loss. They can only optimize within the physical constraint.
Additional shading losses from new HDB erection: 2-6% for affected systems. Systems nearest to new block footprints are most severely affected; some sites in dense Toa Payoh or Tampines estates show more severe impacts.
Forensic detection: Shading from new structures leaves a time-of-day bias in yield deviation. The affected arrays show normal morning production proportional to irradiance, then a systematic dip at the hour when the shadow falls. The pattern stays consistent across seasons and shifts only slightly as sun declination changes.
The Combined Effect
For a typical 100 kWp HDB rooftop system commissioned in 2021 under active construction conditions in Singapore:
| Loss Factor | Modeled | Actual (Forensic) | Gap |
|---|---|---|---|
| Soiling | 2.5% | 6.5% | 4.0% |
| Temperature/MLPE | 1.0% | 4.5% | 3.5% |
| New shading | 0% | 3.5% | 3.5% |
| Total yield gap | 3.5% | 14.5% | 11.0% |
At Singapore's average GHI of 1,580 kWh/m²/year and standard system performance ratio:
- 100 kWp × 1,580 × 0.8 = 126,400 kWh/year projected
- 11% yield gap = 13,900 kWh/year lost per 100 kWp
At S$0.14/kWh offtake (illustrative SolarNova tariff range):
- S$1,946/year per 100 kWp in unrecovered revenue
For an operator managing 1,000 rooftops averaging 100 kWp each (100 MWp total):
- S$1.95M/year in yield gap from undetected, addressable losses
Not all of this is recoverable. New shading is structural. But soiling losses are recoverable through targeted cleaning schedules, and MLPE thermal issues can be partially addressed through operating protocol review and early failed-unit replacement.
What Oxaide Verify Provides for Solar Portfolios
Oxaide Verify's solar forensic module processes your inverter monitoring data, whether it comes from SolarEdge, Fronius Solar.web, AlsoEnergy, or raw exports, and delivers:
- Yield gap quantification: system-by-system breakdown of actual vs. projected yield with component attribution.
- Soiling loss mapping: identification of which sites have elevated soiling vs. expected, enabling priority cleaning schedules.
- Shading change detection: sites where the shadow envelope has materially changed post-commissioning.
- MLPE performance fingerprinting: per-module anomaly detection for failed or degrading inverters and optimisers.
- Revenue recovery roadmap: ordered corrective actions by likely recovery vs. intervention cost.
For operators managing more than 20 sites, the forensic audit typically identifies addressable yield recovery worth 5-10x the audit cost in the first year alone.
Commission a Solar Portfolio Forensic Audit → | Contact for Multi-Site Portfolio Pricing